
Quantified starting point
Dealers start with measurable objectives: predicted annual kWh, structural load limits, and payback horizon. That assessment begins on-site and with irradiance modeling, and it often identifies whether a solar pergola will meet energy targets before a single bolt is turned. My approach uses standardized checks—sun-path analysis, peak-sun-hour ranges (typically 3.5–6.5 hours/day for most U.S. locations), and lateral wind loads—to convert client goals into numeric constraints. California provides a clear policy backdrop that shapes permitting and incentive assumptions for many installers and helps validate modeled returns against real deployments.
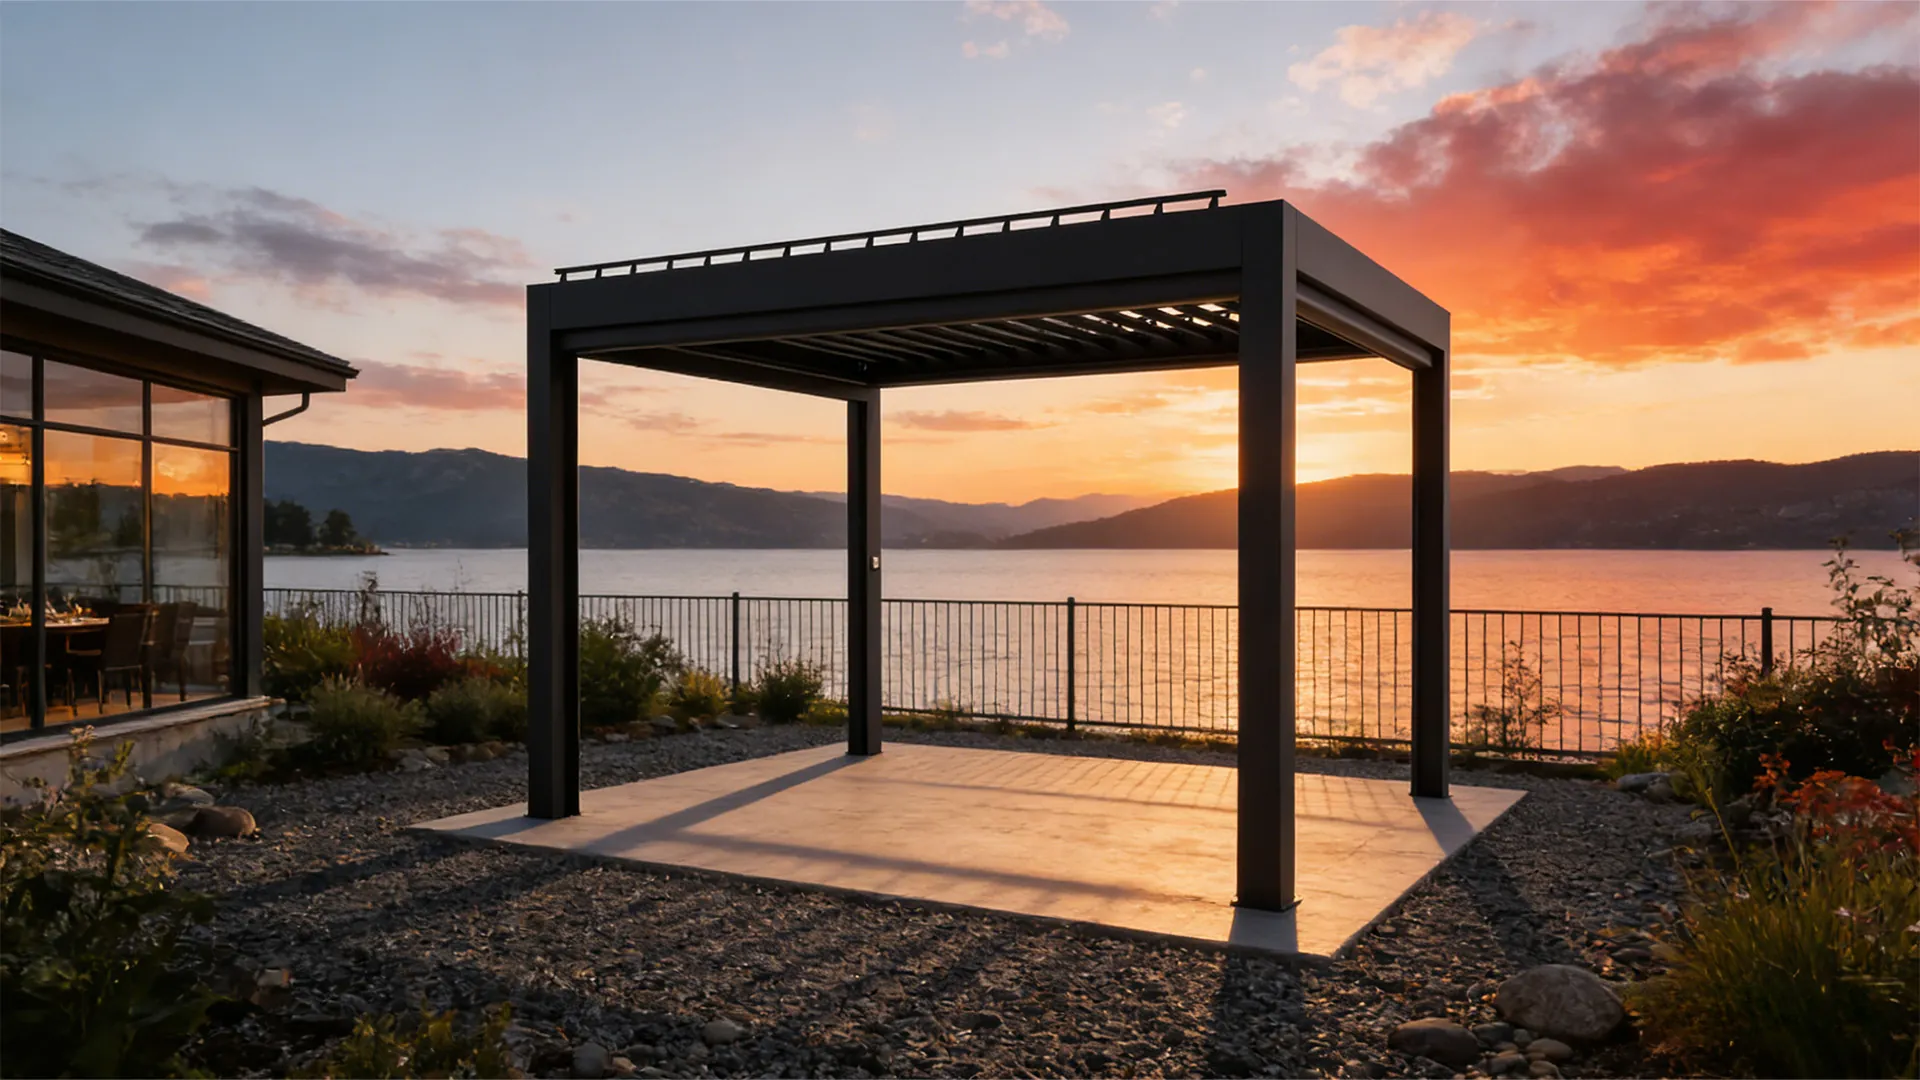
Key metrics pergola dealers measure
Dealers translate performance requirements into six core metrics: available roof or canopy area (m²), module packing density (W/m²), expected annual energy yield (kWh/year), structural capacity (kg/m² or psf), expected shading loss (%), and installed cost ($/W). Use ranges rather than absolutes: yield estimates typically fall within ±10% of modeled output when site surveys and shading maps are accurate. Track each metric as a hard constraint during design and procurement.
How data changes design choices
When measured irradiance is high, dealers prioritize higher packing density and shallower tilt to maximize frontal area. When structural capacity is constrained, they shift to lighter racking and bifacial modules with higher energy density per kilogram. Dealers use simple regressions and scenario simulations: swap module type, re-run shading loss, and compare net present value over 10–15 years. Decisions follow quantified trade-offs, not aesthetics alone.
Common pitfalls—and how to avoid them
Three recurring mistakes reduce long-term value: underestimating shading from seasonal foliage, undersizing footings for local wind loads, and omitting accessible routing for DC wiring and maintenance. Avoid these by running seasonal shading sweeps, conservative geotechnical checks, and designing service channels into the pergola substructure. Those corrections reduce performance variance and lower maintenance-driven downtime.

Alternatives and trade-offs
Compare three practical options by objective: maximize yield (roof-integrated arrays), preserve landscape openness (elevated single-row pergolas), or minimize cost (simple cantilever canopies). Roof-integrated arrays win on yield per dollar but add permitting complexity. Elevated pergolas trade some yield for user comfort and modularity. Dealers quantify these trade-offs with levelized cost of energy (LCOE) scenarios and simple payback timelines so clients pick the option that meets both use-case and ROI constraints.
Installation quality signals dealers monitor
Installers measure torque consistency, grounding resistance, and conduit accessibility during commissioning. Post-install, they track daily yield vs. modeled yield, inverter availability, and degradation rate (%) annually. A persistent 5–10% shortfall from modeled yield signals either soiling, shading drift, or connection losses—each has a distinct corrective path and cost profile.
How to use these data practices on your project
Start with a quantified brief: target kWh/year, budget $/W, and desired lifespan. Require a site report that contains sun-path diagrams, structural load tables, and a sensitivity analysis showing how ±10% change in irradiance affects payback. Prioritize partners who provide measurable commissioning data and a simple dashboard for ongoing performance monitoring; those inputs reduce surprises and produce predictable outcomes. That’s the practical model companies such as Light Hunter apply when they turn measured site conditions into repeatable, long-term value for outdoor solar structures.